
Step right into our newest blog article series, where we're spotlighting the freshest updates straight from HubSpot in 2024!
This edition is all about the latest enhancements to HubSpot CRM, aimed at smoothing your processes, and giving your marketing and sales teams unprecedented capabilities.
Let's dive in and explore these updates together!
What's inside:
1. Content Scaffolding in Custom Templates
2. Conditional formatting in table visualizations within custom reporting
3. Marketing Email Bounce Management Tools
4. Search & Filter Duplicate Records
5. Introducing App Cards Powered by UI Extensions in the App Marketplace
Content Scaffolding in Custom Templates
Content scaffolding gives you control over how generative AI tools add content to your templates. It lets you custom-define the template schema, specifying how different sections of the template should be used and what types of content they should contain.
Content scaffolding allows you to define sections within your content templates that can house AI-generated content. This lets tools like content remix know how to construct content like landing and website pages so that the generated content matches the template's layout. As a result, you can use AI to generate page and email content that matches your organizations' branding—without having to copy and paste content.
How does it work?
Using content scaffolding, you can define places in a page template where HubSpot can insert AI-generated content. When a user generates AI content for a page that uses a scaffolded template, HubSpot will review the theme's scaffolding schema and template configuration to generate and insert more accurate content. Currently, scaffolding only works with the content remix feature.
Adding scaffolding to a template is a two-part process:
- First, you'll create a JSON config file that defines scaffolding fields where AI-generated content should be inserted, along with the type of content to insert.
- Then, you'll update the template to reference the schema and include scaffolding variables as needed.
Our developer documentation will provide full instructions on creating JSON config files.
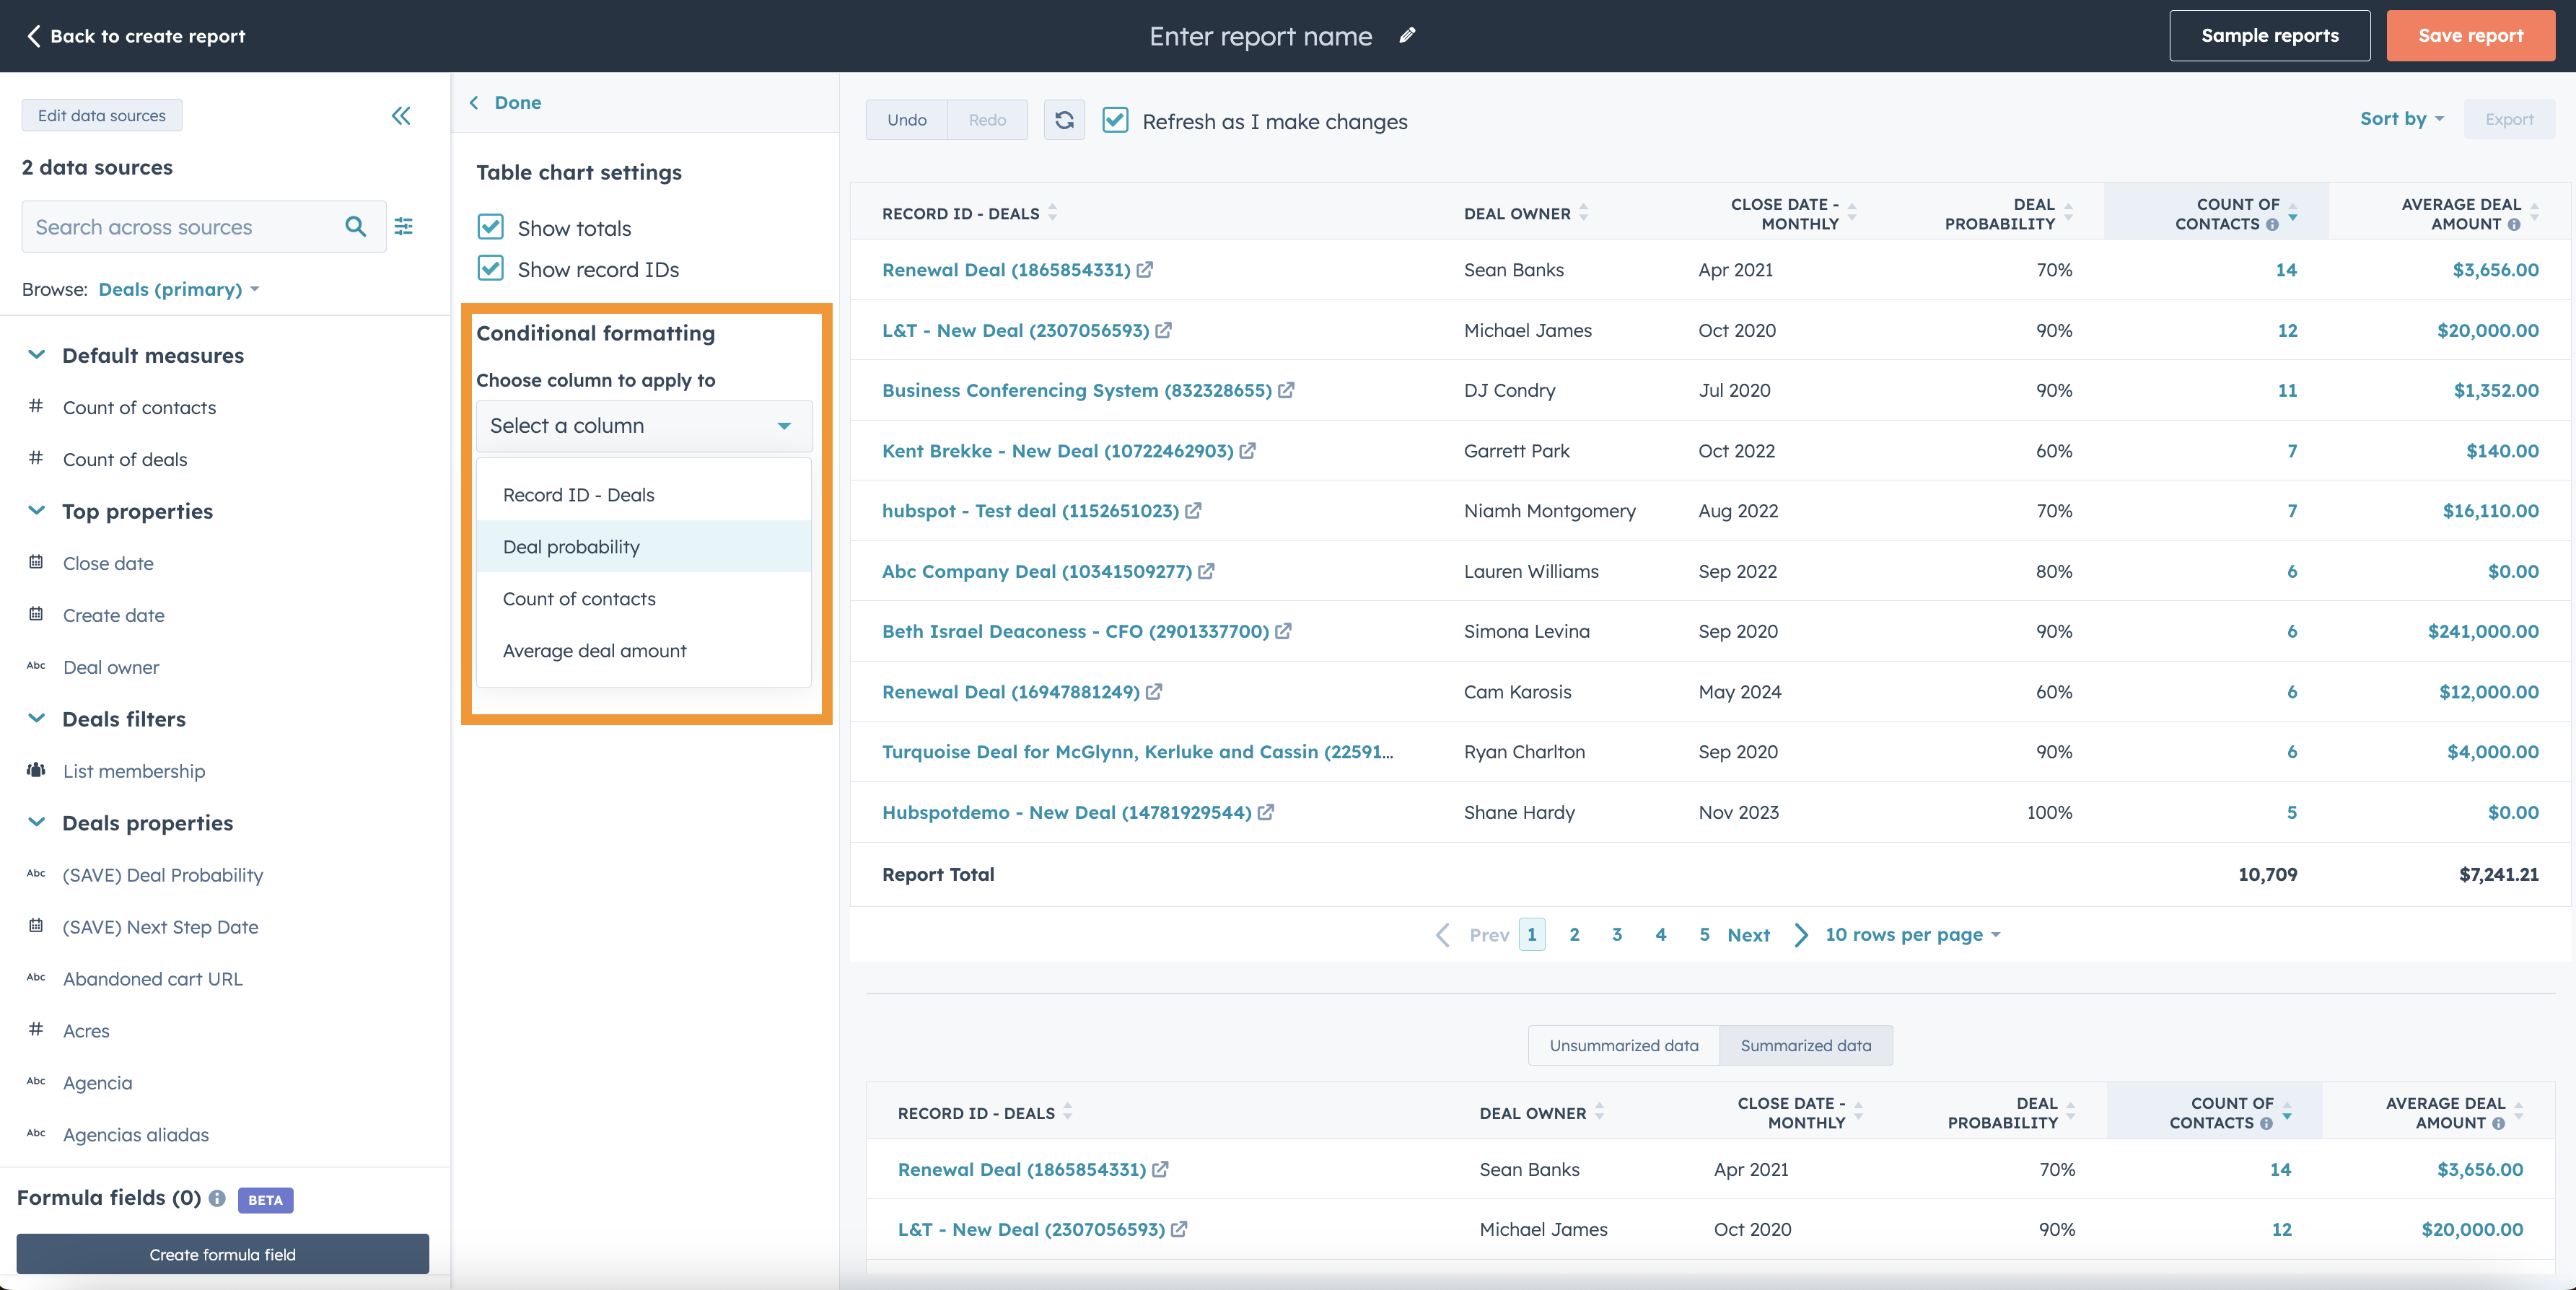
Conditional formatting in table visualizations within custom reporting

Users can apply conditional formatting to tables using the custom report builder or the single object builder. This enables users to format cells based on specific conditions to highlight patterns and trends in data, make certain cells easier to find, or analyze data at a glance.
With conditional formatting, users produce impactful table reports that highlight important data and help viewers develop actionable insights quickly. You can visualize different types of data and format information based on a high, low, or midpoint of a number, currency, percentage, or duration.
How does it work?
Both the custom report builder and the single object report builder allow you to visualize your data in a table format. When using this visualization type, you can activate conditional formatting by clicking into “Chart Settings”.
Custom report builder

Single object builder

Under the conditional formatting section, you can choose from a dropdown of your selected fields of the following property types:
- Number
- Currency
- Percent
- Duration
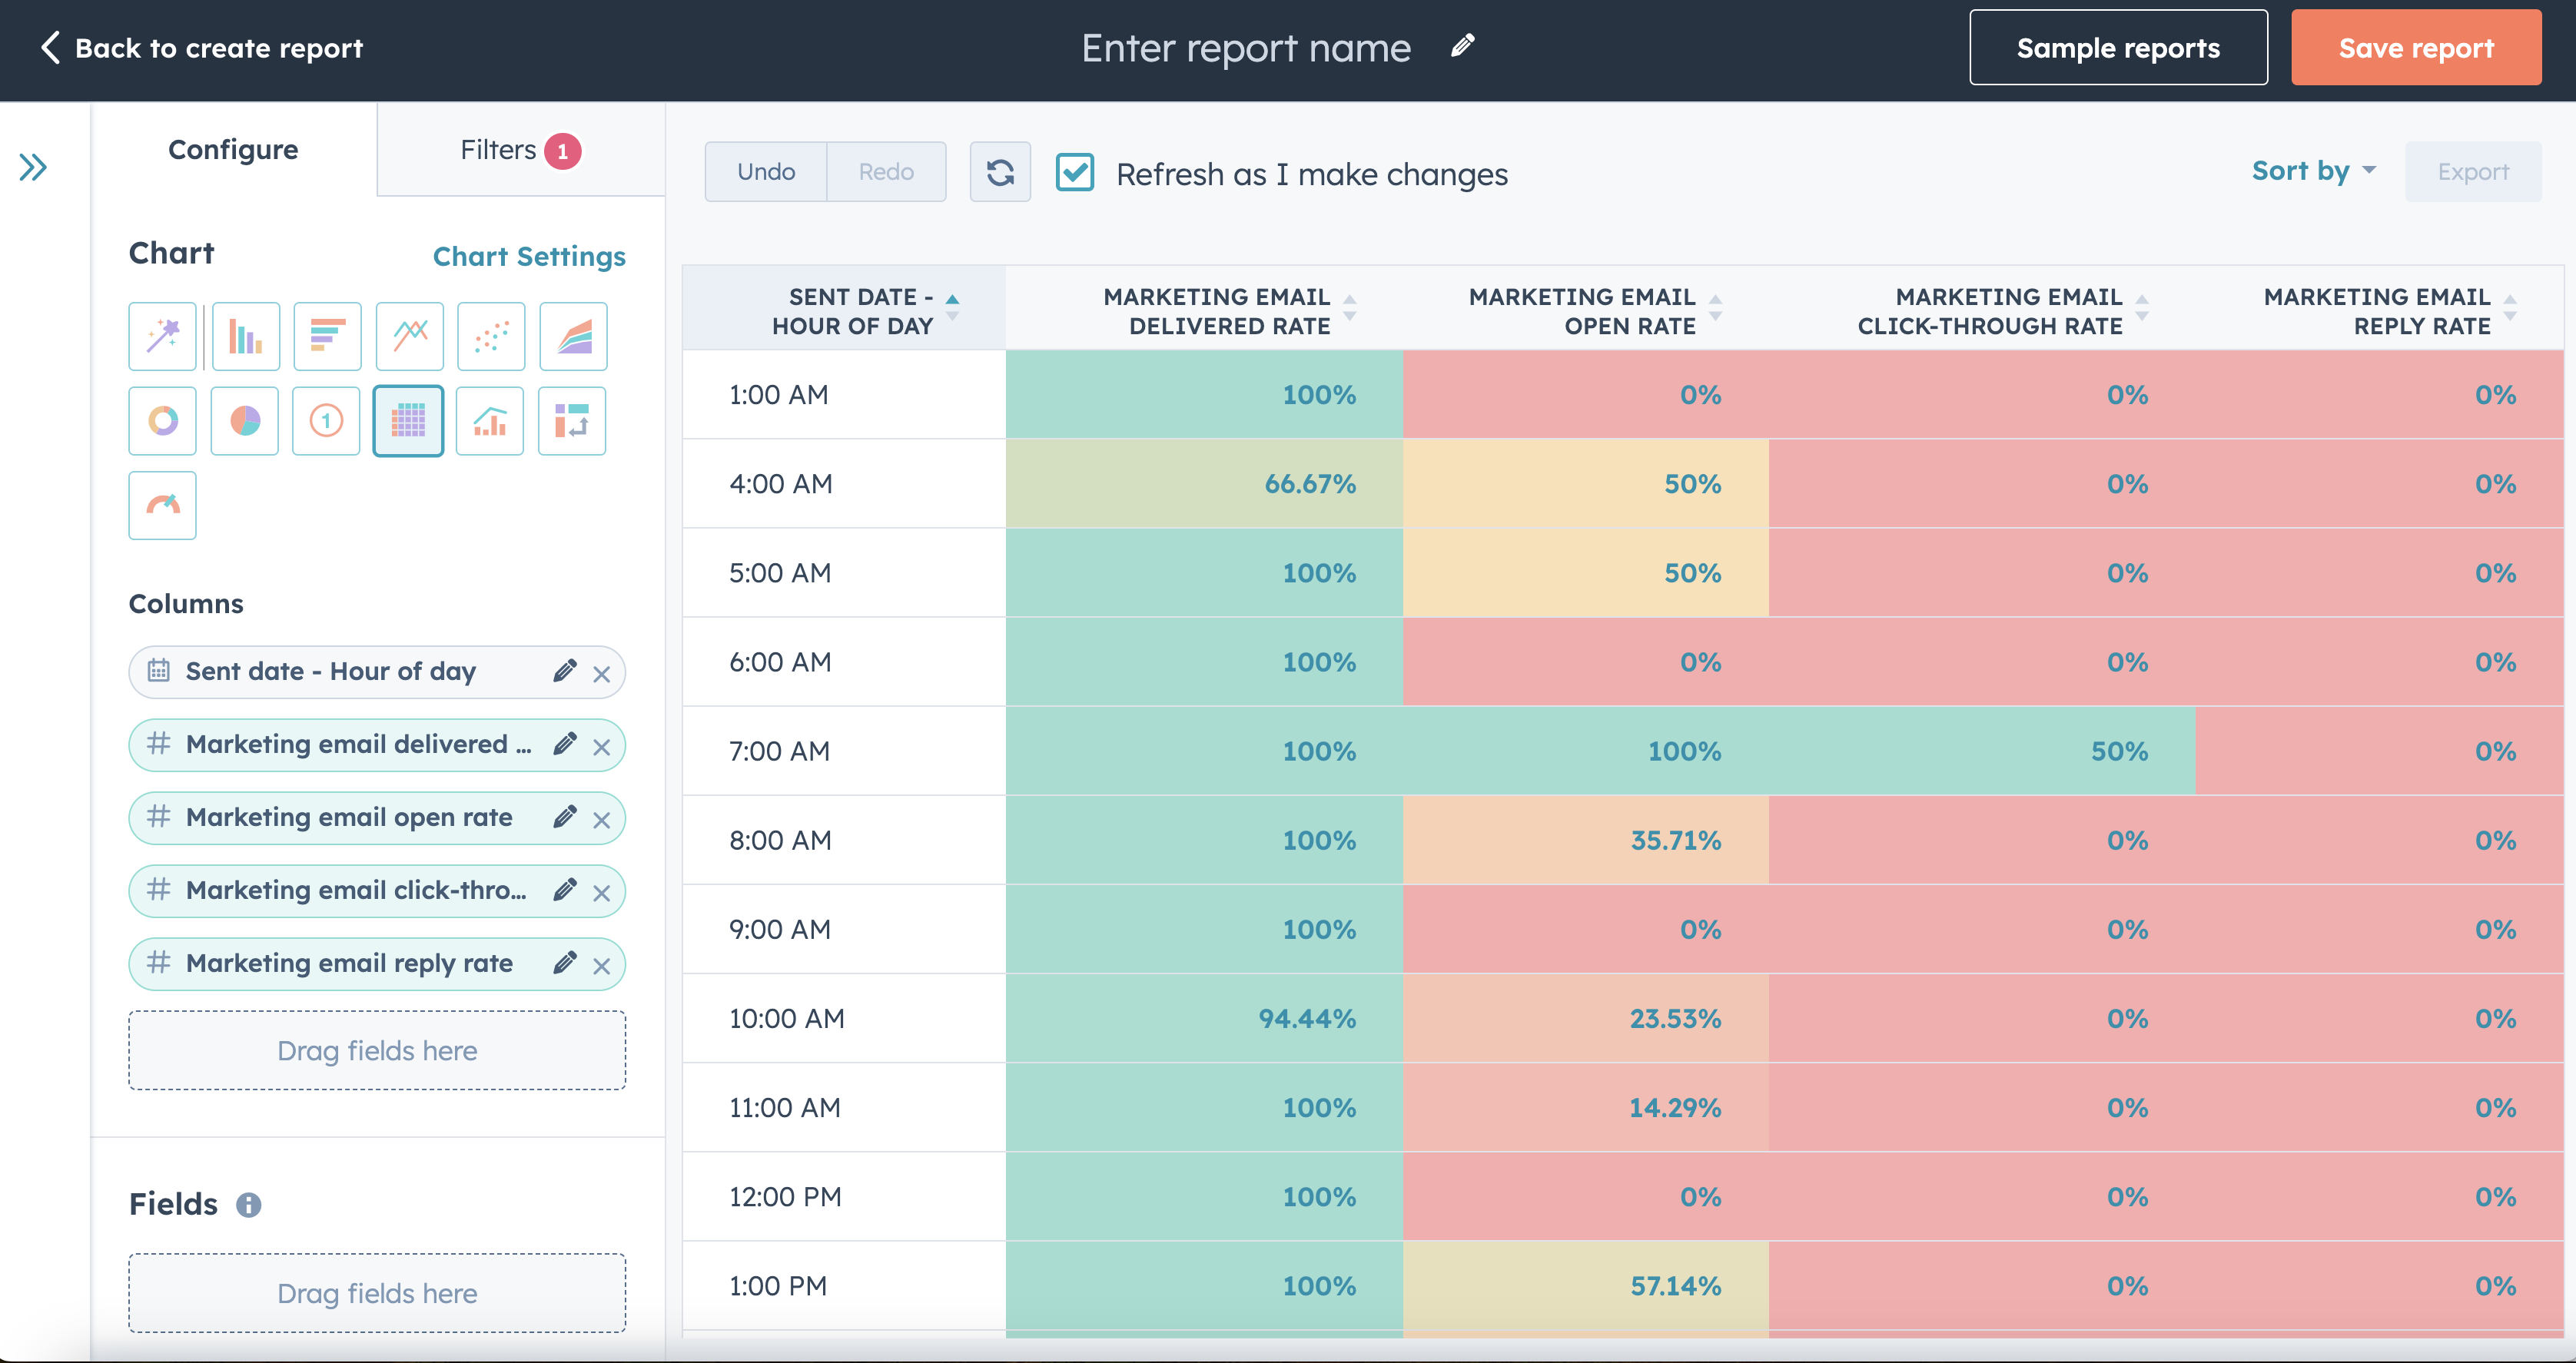
You can select from ten different color palettes, sticking with their automatic color gradient scale or applying your own custom color selection. When a color palette is applied to a table column, it will automatically apply the color scale based on the selected colors for the minimum and maximum values.


You can select from ten different color palettes, sticking with their automatic color gradient scale or applying your own custom color selection. When a color palette is applied to a table column, it will automatically apply the color scale based on the selected colors for the minimum and maximum values.

To add or update conditional formatting on another column, simply select the column of interest in the dropdown and apply your desired settings.


For duration field types, you can set the time measurement you want to define your min, mid, or max. Especially when you have a mixture of duration values (i.e. seconds, minutes, days, weeks) in the same column, this selection will ensure your color scale is based on the correct unit of measurement.


If you'd like to remove any conditional formatting from your table, choose the column you'd like to update and click “Remove conditional formatting” at the bottom of “Table chart settings”.

You are able to apply conditional formatting to any eligible properties included in your table visualization. Oftentimes, having conditional formatting side-by-side can help make your highlights stand out even more.
Marketing Email Bounce Management Tools
This November, we will be sunsetting the following features from Marketing -> Email -> Email Tools:
- Add hard bounced contacts to an existing list
- Export Contacts who have unsubscribed or bounced
How can I get this data moving forward?
Add hard bounced contacts to an existing list
- Go to the list you want to modify
- Add the following filter

Export Contacts who have unsubscribed or bounced
To understand whether a contact is unsubscribed from all email, the portal user can create a list filtered by contact property “unsubscribed from all”

To understand whether a contact is subscribed or unsubscribed from a specific subscription type, the portal user can create a list filtered by one of the opt status options (Contact > Email Subscriptions) and then select the subscription type they would like to view:


Search & Filter Duplicate Records
Introducing powerful new search and filtering capabilities in our duplicate management tool. Now you can precisely target duplicate records based on key attributes:
For contacts, filter by:
- Contact owner
- Lifecycle stage
- Create date
- Last activity date
For companies, filter by:
- Company owner
- Creation date
- Last activity date
Additionally, our new search function enables you to find specific records instantly within your duplicates. Together, these features streamline your data cleansing process
Why does it matter?
The new search and filtering features revolutionize duplicate management, empowering users to focus on the pairs that matter most. By instantly surfacing relevant duplicates, this enhancement dramatically boosts efficiency and user satisfaction. This streamlined process not only saves valuable time but also enhances data accuracy, enabling businesses to make more informed decisions and optimize their workflows for greater productivity.
How does it work?
The new search and filtering options are now seamlessly integrated into the interface, as shown below:

Introducing App Cards Powered by UI Extensions in the App Marketplace
Introducing app cards, flexible surfaces that give you a custom way to display, sync, and action data between HubSpot and your third-party tools. App cards replace classic CRM cards with richer app experiences without leaving HubSpot.
Apps with app cards are also featured in a collection that extends beyond the App Marketplace and into HubSpot, embedded where this type of customization is most relevant and instantly available. Apps in this collection include:
- Arrows – win more deals and onboard customers faster
- DealHub – manage deals end-to-end with a unified and agile CPQ platform
- Dusk FSM – power field service teams to deliver exceptional customer experiences
- event•hapily – manage events right inside HubSpot
- Fathom AI Notetaker – create and sync meeting summaries instantly with contacts and deals
- FlashCTA – customize HubSpot with actionable buttons
- Hippo Video – add videos to HubSpot emails, landing pages, and sequences
- PandaDoc – create, track, and execute sales proposals and contracts inside HubSpot
- PartnerStack Network Connect – manage referrals more easily between sales teams
- QuotaPath – manage, forecast, and track commissions directly in HubSpot
- RevOps – a modern and scalable deal desk platform for HubSpot
- Sendoso – a smart gifting platform to delight customers and increase win rates
- StopWatch – intuitive time tracking, managed entirely within HubSpot
- Survicate – run a variety of survey types integrated with HubSpot
App cards allow you to get more from your other tools. Extend the power of HubSpot to connect your teams, apps, and data, so they work better together.
Customize with app cards to dynamically match your unique business needs. Save time, reduce context-switching, and work where you're most comfortable – in HubSpot.
Empower your team. Meet them where they are with actionable, centralized, and contextual insights that unlock better productivity, decisions-making, and organizational growth.
How does it work?
HubSpot admins can configure app cards on the record middle column, right sidebar, preview panel, and helpdesk ticket sidebar across all standard objects with record pages. And, we'll continue to open up more surfaces. Learn more about app card configuration on the HubSpot Knowledge Base.
Please note:
- For apps that are already installed, if they now require additional permissions, you will need to reinstall and approve access.
- Apps with this new functionality are gradually rolling out to their existing user base. If you don't see app cards available yet, don't worry, they're on their way to a portal near you!